故障现象
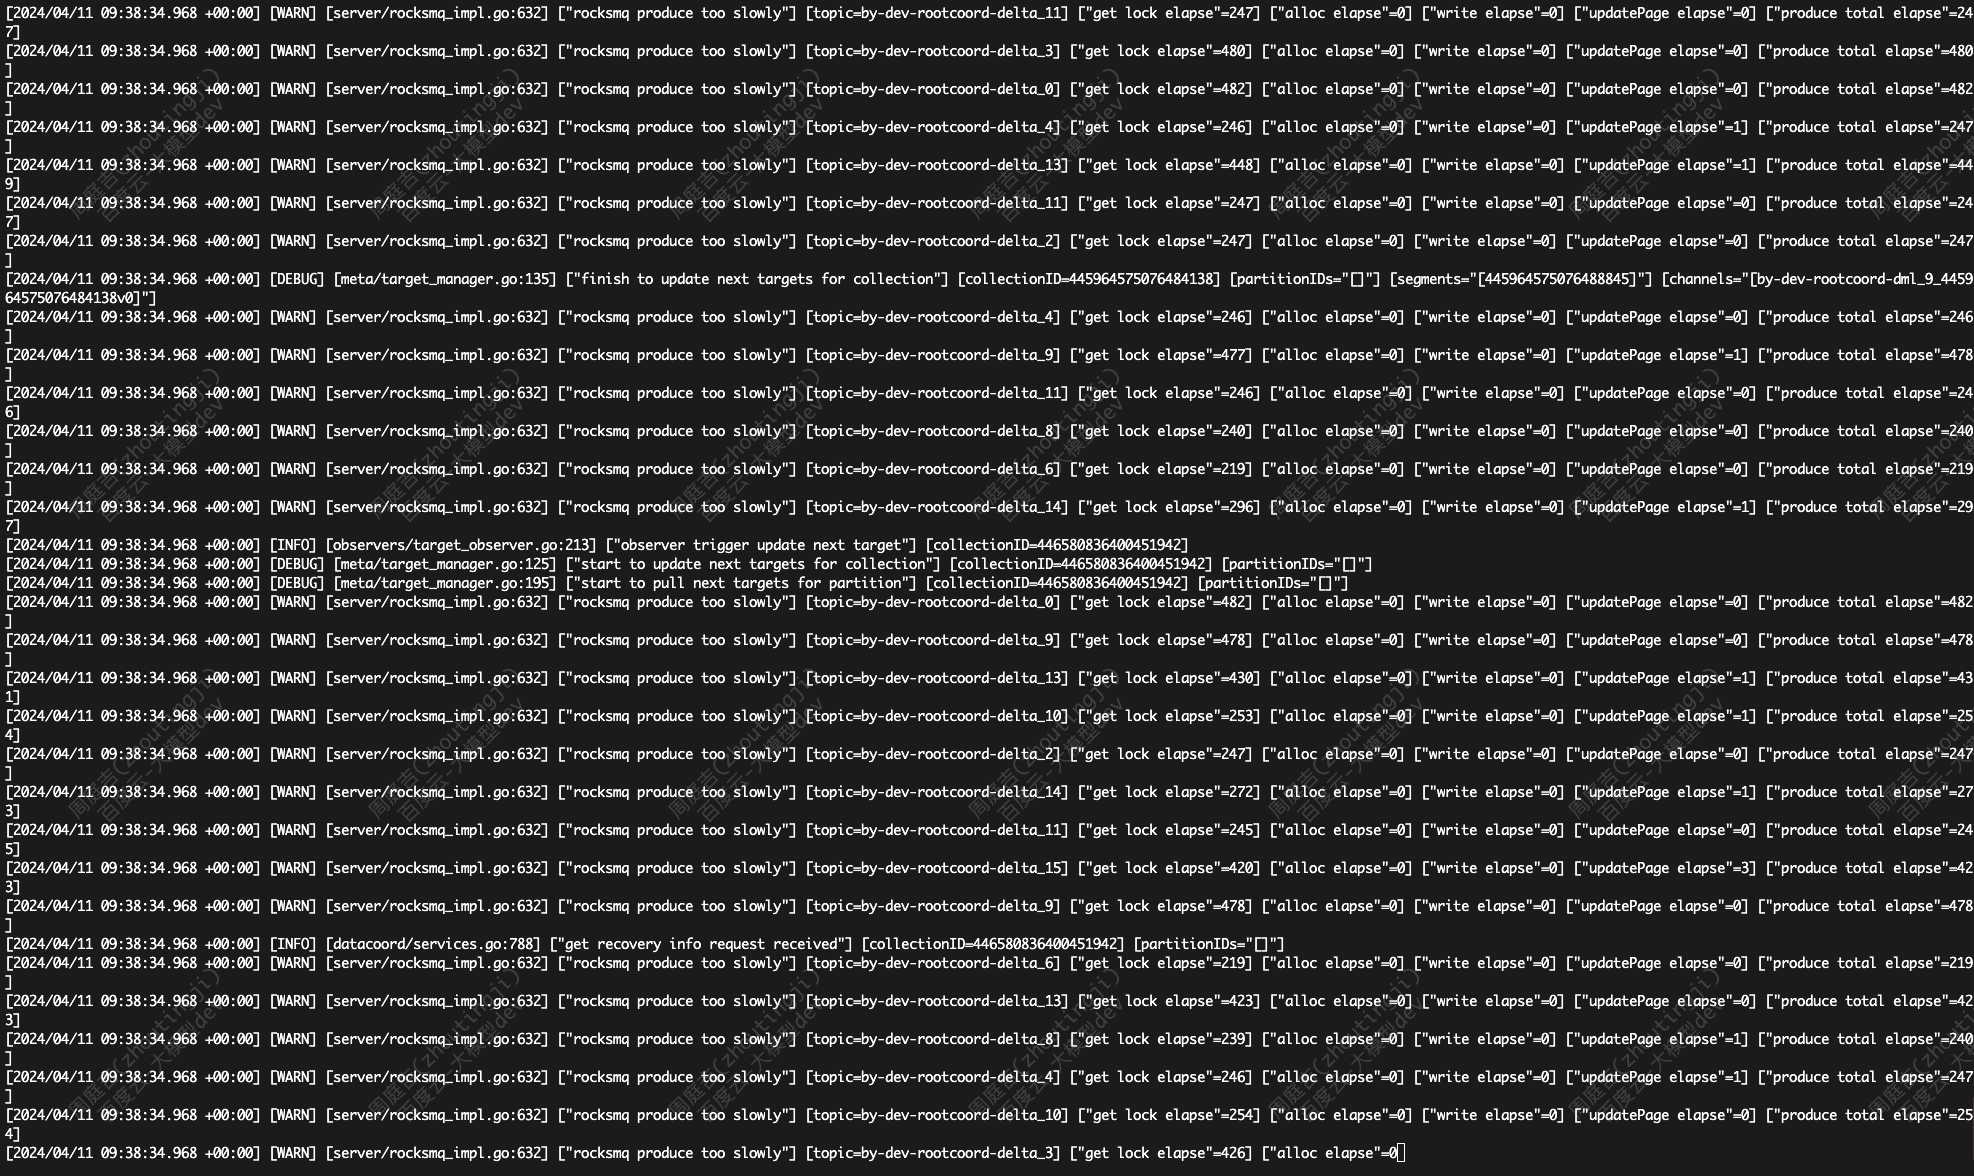
- 日志非常多
- CPU占用高
- 服务不可用
故障原因
- milvus官方bug
- rocksmq hold topic lock.
- cluster has too many collections, when cluster start from cold, all of the consumer try to pull data from rocksmq and causing the system hard to recover and stayed in a loop to catch up new data.
解决方案
- 升级milvus版本>=2.3,即可解决
- 如需要在当前版本修复
- 将参数proxy.timeTickInterval设置从200改为1000
- 删除/var/lib/milvus/rdb_data,删除/var/lib/milvus/rdb_data_meta_kv,再重启
参考信息
I think the major reason is the lock of rocksmq hold topic lock.
And due to this cluster has too many collections, when cluster start from cold, all of the consumer try to pull data from rocksmq and causing the system hard to recover and stayed in a loop to catch up new data.
We have refine idle scene at master(remove time tick channel) and 2.3. For version 2.2, i will optimize rocksmq and try to do something helpful.
This question caused by that rocksmq cpu usage will increase with data, and idle milvus will send time tick massage by rocksmq, and cpu usage will increase.
So reduce interval of time tick massage or reduce interval and size of rocksmq retention could help reduce cpu usage.
collections numbers do significantly affect cpu usage, especially on standalones from our test.
We recommend to use < 1000 collections.
Also if we know more about your use cases maybe we can give more advices
Upd: I have loaded collections after deleting
/var/lib/milvus/rdb_dataand/var/lib/milvus/rdb_data_meta_kvand restarting Milvus.
Upd2: Seems to work well so far! Will observe it further for a couple of days and get back. Also, there is way less logs fromstandalonenow.
proxy. timeTickInterval from 200 to 1000 see if it works.
发表回复